


- TL;DR: This article explains what DevOps observability means, how it differs from monitoring, why your business needs it, and how to implement it effectively.
- What observability is: The ability to understand what’s happening inside your application and infrastructure by examining the data they produce. DevOps observability stands on four pillars: metrics, logs, traces, and profiles.
- Observability vs monitoring: Monitoring tracks WHAT is happening through predefined metrics. Observability reveals WHY something happened using all available telemetry data.
- How it works: Tools continuously gather data from every part of your system, track user requests step by step, detect unusual patterns, and create a complete view of what happens inside complex architectures.
- Three key benefits of DevOps observability are faster development cycles, faster issue resolution, and proactive performance management.
- We covered six categories of DevOps tools that cover observability.
- And also wrote a six-step guide on the observability building process, covering everything from defining business objectives and inventorying systems to deploying tools and configuring alerts.
Every software team knows this moment when everything goes wrong. The database locks up during Black Friday sales. API calls timeout while customers try to checkout. Memory leaks crash servers at 3 AM. Critical services fall right before a major product launch, etc. All these 4 types of incidents actually share a common thread: software teams lack visibility into what’s happening inside their systems. DevOps observability solves this blindness by giving teams the very information they need to prevent problems when possible and respond faster when issues arise.
Even the most lightweight modern applications generate massive amounts of data through logs, metrics, traces, and performance indicators. What to say about the sophisticated enterprise systems producing exponentially more data?!
DevOps observability handles these data floods by capturing and analyzing all available information to reveal system behavior patterns. With it, organizations gain unprecedented insights into application performance, user experience, infrastructure health, and security posture. This comprehensive view enables software teams to shift from reactive crisis management to proactive system optimization.
As a DevOps automation service company with a decade of experience, we at ELITEX have witnessed countless organizations and businesses across various economic domains struggling with system visibility challenges. The shift from monolithic architectures to distributed microservices architecture (we have a separate article about this shift explaining why microservices architecture is so popular in DevOps lately) has made monitoring and visibility exponentially more complex. Nowadays, in 2026, software teams need robust observability in order to stay operational and deliver reliable services more than ever before. That’s why we decided to share our experience and write today’s guide. In it, we’ll examine what DevOps observability practically means, why it matters for modern businesses, how to implement it effectively within your organization, what tools work best for different scenarios, and which common mistakes to avoid during implementation. So, without any further ado, let’s go!
What is observability in DevOps?
In DevOps, observability is the ability to understand system internal states based on external outputs. Simply put, DevOps observability tells you what’s happening inside your applications and infrastructure based on examining the data they produce. This capability becomes critical when dealing with complex distributed systems where traditional debugging approaches fall short. Observability gives your software teams a comprehensive view of system behavior across all software components and their interactions by correlating data from multiple sources to reveal patterns and dependencies.
At first glance, observability may sound very similar to monitoring, another aspect of DevOps culture. However, in practice, it differs from traditional DevOps monitoring in scope and approach—we’ll explore these distinctions in the following section.
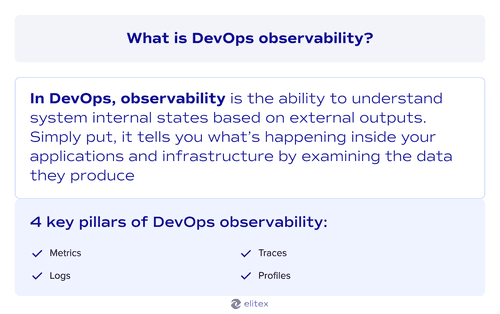
Core pillars of observability in DevOps
Observability also traditionally stands on four pillars:
- Metrics: Entities that collect numerical measurements over time periods. CPU usage, memory consumption, response times, error rates, and throughput levels fall into this category;
- Logs: They provide detailed records of system events and application behavior, capturing what happened, when it occurred, and often including contextual details (here we have a separate article about logging in microservices);
- Traces: They track individual requests as they move through distributed systems, revealing the complete path and timing of user interactions across multiple services;
- Profiles: Profiles analyze code performance and resource consumption at the application level, identifying which functions or processes consume the most CPU, memory, or other resources during execution.
Observability vs monitoring: Key differences
Now, let’s return to the difference between DevOps observability and monitoring, one of the principal elements of any DevOps automation process. Although these two concepts may seem similar at first glance, in system management, they generally serve distinct purposes.
Trying to keep it as simple as possible, let’s say that observability focuses on understanding WHY something happened using all available telemetry data, while monitoring tracks WHAT is happening through predefined metrics.
Here’s a more detailed comparison of these two concepts:
| Aspect | DevOps monitoring | DevOps observability |
| Question answered | “What”, “when”, “is the server down”, “are we hitting resource limits”? | “Why”, “how”, “why do users abandon carts on mobile”, “which code path causes memory leaks”? |
| Scope | Tracks known metrics and thresholds: CPU, memory, disk usage, network traffic, etc. | Explores unknown system behaviors, tracks application traces, user journeys, business metrics, code performance, etc. |
| Purpose | Detects when systems exceed limits | Investigate why problems occur (e.g., understanding why the checkout process fails for specific user segments) |
| Data collection | Monitoring data from specific observability tools like Prometheus or CloudWatch | All available telemetry data: logs, metrics, traces, profiles from OpenTelementry, Jaeger, APM tools |
| Infrastructure monitoring | Focuses on hardware and network metrics: server health, network connectivity, storage capacity | Includes application and business context: service dependencies, request flows, business transaction impact, etc. |
As can be seen from the information above, monitoring uses predefined thresholds to detect known problems, while observability enables investigation of unknown issues through comprehensive data exploration.
Also read ouur article about DevOps metrics.
How DevOps observability works: A simplified explanation
Also read our article about shift-left in DevOps.
DevOps observability works by continuously gathering data from every part of your software system. Applications send logs about their activities, servers report their resource usage through metrics, user requests get tracked as they move between different services, and infrastructure components generate events about configuration changes. Special observability tools (we will return to them a bit later) collect this information and store it in central locations where software teams can analyze patterns and connections based on the gathered data. The ultimate goal is to create a complete view of what happens inside complex microservice architectures.
When users interact with your software product, distributed tracing follows their requests step by step. Each service the request touches adds information about response times, errors, resource consumption, network latency, and database query performance. This creates a detailed map of user journeys through your system. Your team can see exactly where slowdowns occur and which services cause problems. System performance data gets combined with user behavior information to show how technical issues affect business outcomes.
Then, these special observability platforms use collected data to detect problems early through intelligent alerting mechanisms. Instead of waiting for complete failures, your team gets notified about unusual patterns that might indicate developing issues. Application security threats, memory leaks, performance issues, configuration drift, and dependency failures become visible before they impact customer experience. When incidents do occur, your team has rich historical data for incident management. That’s a good alternative to scrambling to piece together what went wrong without an implemented observability strategy. Such an approach shifts your system health monitoring from reactive firefighting to proactive problem prevention.
Building a DevOps observability is an important step in reaching DevOps maturity.
Key benefits of DevOps observability for your development strategy
Here are 3 clear reasons why your business needs to build a robust DevOps observability strategy:
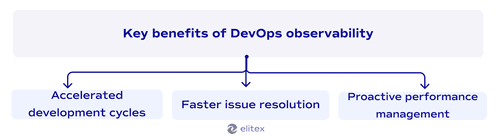
Faster issue resolution: DevOps observability involves continuously collecting data about your software product from every possible source. When done properly, your teams see exactly which databases slow down and which servers stop responding during problems. This data points to the real problem source. Quick incident responses, in turn, prevent revenue loss. It’s one of the key DevOps benefits that allows you to keep customers satisfied and business operations running smoothly during critical periods.
Proactive performance management: With data trends, system performance gets better over time. DevOps observability allows your teams to watch response times climb way before users notice slowdowns and make performance optimization based on real numbers instead of guesses. A proactive approach to DevOps transformation helps you build a system that minimizes emergency fixes and midnight crisis calls.
Essential tools and technologies for DevOps observability
Implementing an effective observability strategy requires the right combination of specialized tools that work together seamlessly. We have a comprehensive article about DevOps automation tools, where we explain how monitoring tools integrate into broader automation strategies. The following observability DevOps tools represent the most essential categories for building robust monitoring systems:
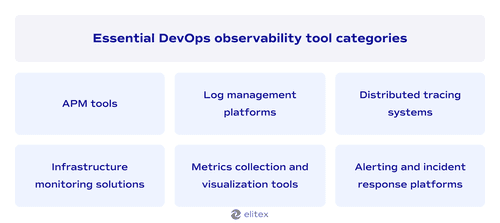
Application performance monitoring tools, also known as APM tools, track code-level performance and user experience across your entire application stack. These DevOps observability tools provide deep insights into function execution times and database query performance. Leading solutions in this category are New Relic and Dynatrace.
Log management platforms centralize and analyze log data from distributed systems. They transform unstructured text into searchable, actionable information for troubleshooting. Popular options in this category are Splunk, ELK Stack (Elasticsearch, Logstash, Kibana), Fluentd, and Graylog.
Distributed tracing systems follow requests through microservices architectures, showing the complete journey of user interactions. These tools are typically used to identify bottlenecks in complex service chains. Key platforms here are Jaeger and Zipkin.
Infrastructure monitoring solutions provide real-time visibility into service health, network performance, resource utilization, application dependencies, and security posture across cloud and on-premise environments. The list of infrastructure monitoring solutions trusted by ELITEX includes Prometheus, Nagios, Zabbix, and DataDog.
Metrics collection and visualization tools gather numerical data points and present them through customizable dashboards. These monitoring systems help teams spot trends and anomalies in system behavior. Top choices in this category are Grafana, Kibana, and Tableau.
Alerting and incident response platforms automatically notify teams when predefined conditions occur and coordinate response efforts. They typically integrate well with other observability tools in order to provide context-rich notifications. Industry standards include PagerDuty, VictorOps, and Alertmanager by Prometheus.
Also read our article about DevOps-as-a-Service.
How to implement observability in your DevOps pipeline
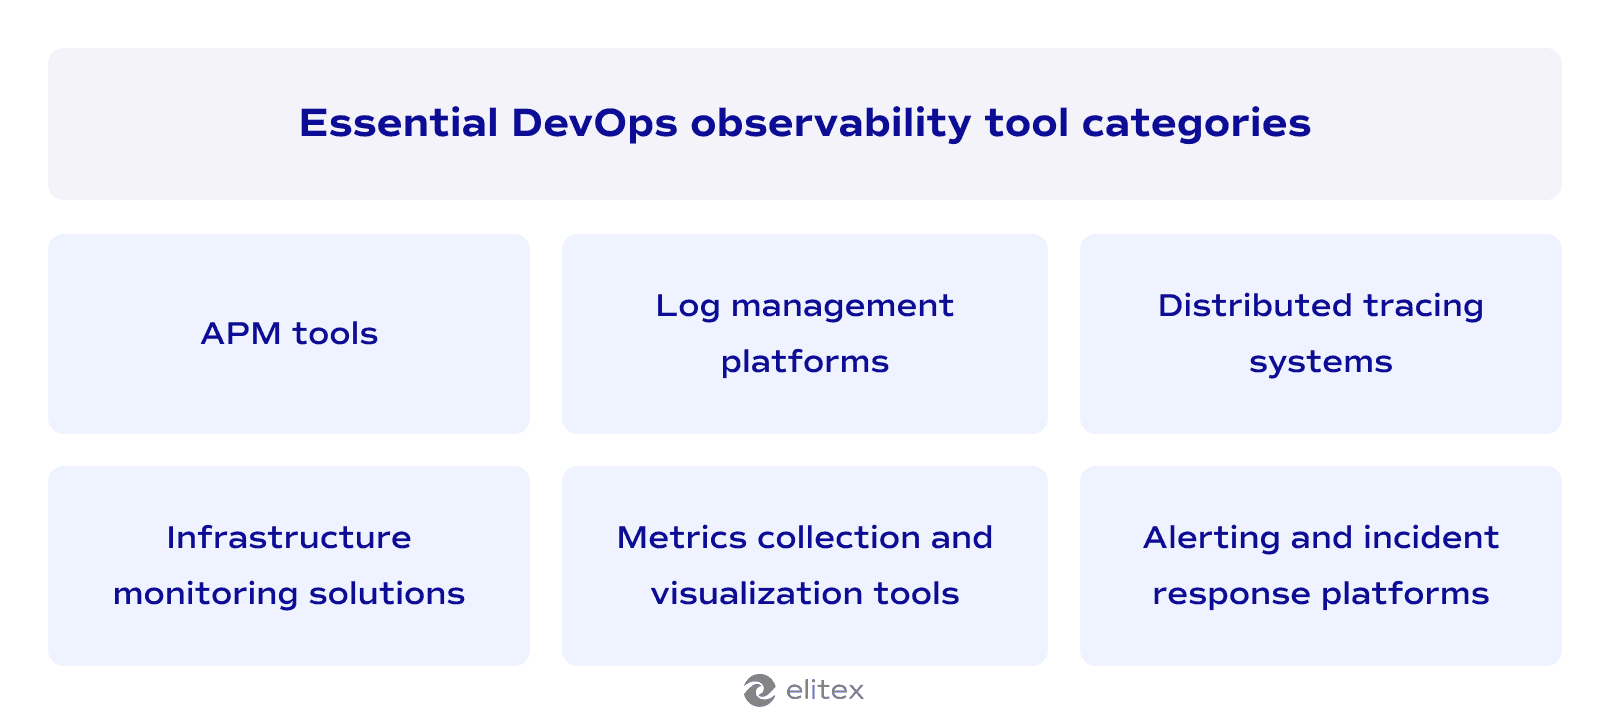
Here’s an algorithm for implementing observability into your DevOps pipeline based on our decade-long experience in DevOps and custom software development:
Step 1: Define clear business objectives and success metrics. Identify which business outcomes need improvement through better system visibility that you want to build. Set clear metrics, such as reduced downtime or faster incident resolution.
Step 2: Inventory current systems and data sources. Carefully catalog all applications, services, infrastructure components, databases, and third-party integrations. This step will reveal your monitoring gaps in order to better understand the way to improve existing data sources.
Step 3: Select and deploy core observability tools. Choose observability tools matching your technology stack. Start deployment with logs, metrics, and tracing for critical applications.
Step 4: Establish data collection standards. Implement consistent logging and metric practices across your software product. Standardized data enables effective correlation during troubleshooting.
Step 5: Configure alerting and notifications systems. Set up intelligent alerts for business-impacting events. Focus alerting and notifications on relevant issues without creating alert fatigue.
Step 6: Create dashboards and response procedures. Build role-specific monitoring dashboards. Establish incident response procedures using observability data.
Challenges in achieving effective observability
| Challenge | Possible mitigation strategy |
| Data volume overload: Your software generates massive amounts of telemetry data that overwhelm storage and analysis capabilities. | Implement intelligent data sampling and retention policies. Use automated filtering to focus on business-critical metrics and anomaly detection. |
| Tool integration complexity: Multiple observability tools create data silos and inconsistent interfaces across a single software product. | For beginning, standardize on unified observability software, such as Datadog or New Relic, or use APIs to integrate disparate tools. Establish common data formats and correlation keys. |
| Alert fatigue: Too many notifications reduce response effectiveness and cause important alerts to be ignored by your team. | Configure intelligent alerting with dynamic thresholds and correlation rules. Implement escalation policies that prioritize business-impact severity. Here, the rule is: business metrics are always a top-priority. |
| Cost management: Observability infrastructure and tooling costs escalate rapidly. | Monitor tool usage and optimize data retention periods. Use cost-effective open-source solutions where appropriate and implement usage-based billing controls. |
| Legacy system integration: Older applications lack modern instrumentation capabilities and resist observability implementation. | Use external monitoring agents and log parsing for legacy systems. Gradually modernize applications during maintenance cycles to add proper instrumentation. |
6 Observability best practices for DevOps teams
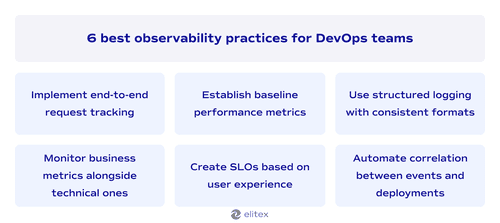

- Implement end-to-end request tracking. Track user requests from the frontend to the database and back. This full-stack observability is an effective approach, as you see the complete user journey.
- Establish baseline performance metrics. Measure normal system behavior during peak and off-peak hours. Document typical response times, error rates, resource usage patterns, and network latency. These baselines help identify when performance deviates from expected ranges.
- Use structured logging with consistent formats. Standardize log formats across all applications and services. Include correlation IDs that link related events together. Structured logs enable faster searches and automated analysis during incidents. Continuous monitoring in DevOps becomes more effective with consistent data formats.
- Monitor business metrics alongside technical metrics. We have already mentioned this in the previous section, but, again: track revenue, conversion rates, user engagement, and anything else that is relevant for your business alongside with system performance data.
- Create service level objectives based on user experience. Define acceptable performance thresholds from the customer perspective rather than internal system limits. Focus on metrics like page load times and transaction success rates that directly impact user satisfaction.
- Automate correlation between events and deployments. Link system changes to performance impacts automatically. Tag deployments, configuration updates, and infrastructure changes in your observability data.
The future of observability in DevOps
Guessing the future is always a sort of magic. Unfortunately, we’re not fortune-tellers here at ELITEX, and the only things we know exactly are current DevOps trends. And they clearly point toward smarter and more automated observability solutions. Machine learning integration is transforming how DevOps teams detect anomalies and predict system failures before they impact end users. AI-powered monitoring tools now provide intelligent insights that reduce manual investigation time and help less technical software team members understand complex system behaviors.
The aforementioned end-to-end observability is becoming standard practice, with modern tools offering comprehensive visibility across entire application stacks rather than isolated monitoring points. Native integrations and one-click deployment are making advanced observability accessible to smaller teams without dedicated platform engineers. This evolution suggests that future observability will be more proactive, intelligent, automated, and democratized across development teams of all sizes.

FAQ about DevOps observability
What is DevOps observability?
DevOps observability is the ability to understand internal states of your software product based on external output. Simply put, DevOps observability tells software teams what’s happening inside the application and infrastructure by examining all the data they produce.
How does observability in DevOps differ from monitoring?
It’s about the DevOps foundations. Monitoring and observability basically serve different purposes. Observability focuses on understanding WHY something happened using all available telemetry data, while monitoring tracks WHAT is happening through predefined metrics and thresholds.
What are the core pillars of DevOps observability?
The four pillars are metrics (numerical measurements), logs (detailed event records), traces (request tracking through systems), and profiles (code performance analysis).
Why is DevOps observability critical for businesses?
It accelerates software development cycles through immediate feedback, enables faster issue resolution by pinpointing the exact problem sources, and supports proactive performance management using data trends.
What tools are essential for implementing DevOps observability?
Essential tools span six categories. 1. APM solutions (New Relic, Dynatrace, AppDynamics) track code-level performance and user experience; 2. log management platforms (Splunk, ELK Stack, Fluentd, Graylog) centralize and analyze log data from distributed systems; 3. distributed tracing systems (Jaeger, Zipkin) follow requests through microservices architectures; 4. infrastructure monitoring solutions (Prometheus, Nagios, Zabbix, DataDog) provide real-time visibility into service health and resource utilization; 5. metrics collection and visualization tools (Grafana, Kibana, Tableau) gather numerical data and present customizable dashboards; 6. alerting and incident response platforms (PagerDuty, VictorOps, Alertmanager) automatically notify teams and coordinate response efforts.
POSTED IN:
