


- TL;DR: This article covers DevOps metrics frameworks, operational KPIs, and how to pick the right ones for your team.
- We talk about two main frameworks: DORA and SPACE. DORA measures pipeline speed and stability through four metrics. SPACE adds human factors like satisfaction and collaboration.
- Both frameworks work best together: DORA as the baseline, SPACE as the broader lens.
- We also mention operational metrics like error rate, response time, test coverage, and uptime, which neither framework covers
- We explain how to implement metrics tracking into your workflow in 6 actionable steps and best practices for using these metrics.
- Also, we talk about specific DevOps tools like Datadog, Grafana, and LinearB that may help with this task.
Every engineering team wants to ship faster without breaking things. But "faster" means nothing without a way to measure it. That's where DevOps metrics come in. At ELITEX, a decade of providing DevOps automation services and solutions has taught us that the real challenge is picking the right framework and the right KPIs for your specific context. In this guide, we break down DORA, SPACE, and other measurement approaches so you can focus on the numbers that actually move your product forward.
What are DevOps Metrics
DevOps metrics are quantifiable indicators that show how well your development and operations processes work together. They are kin to a diagnostic panel for your entire software delivery lifecycle. Without structured DevOps measurement, teams end up relying on gut feelings or anecdotal evidence when making decisions about their pipelines. The right metrics tell you where bottlenecks hide, how stable your releases are, and whether your engineering effort actually translates into business outcomes.
Why do you need DevOps metrics?
1. You get a clear answer to how to measure DevOps success. Opinions about team performance vary. Metrics don't. When you track the right DevOps success metrics, conversations about delivery speed and quality shift from subjective debates to data. You see exactly which stages slow your pipeline down. You spot recurring failures before they compound. This kind of clarity makes every DevOps strategy decision more precise.
2. You find what slows your releases down. Slow releases cost money. Every extra day between code commit and production deployment stretches your time to market and gives competitors room to move ahead. DevOps metrics reveal where this time goes. Maybe your approval process adds two days of waiting. Maybe test environments take hours to provision. Once you see the bottleneck, your team can remove it. Without measurement, you're guessing which fix will actually shorten the cycle.
3. You protect quality while scaling output. Faster delivery means nothing if application performance degrades with every release. Metrics create a feedback loop that keeps quality visible even as your team grows. You can monitor developer productivity without resorting to micromanagement because the numbers speak for themselves. When a spike in deployment frequency correlates with rising failure rates, you catch the pattern early and adjust before users feel the impact.
Frameworks of DevOps metrics and KPIs
So you know what DevOps metrics are and why they matter. The next question is which DevOps metrics framework fits your development pipeline. There is no single model that captures everything. Some frameworks focus on delivery speed. Others account for team well-being and collaboration patterns. Below, we walk through DORA and SPACE as the two most adopted approaches, then look at operational metrics that sit outside both.
DORA DevOps metrics
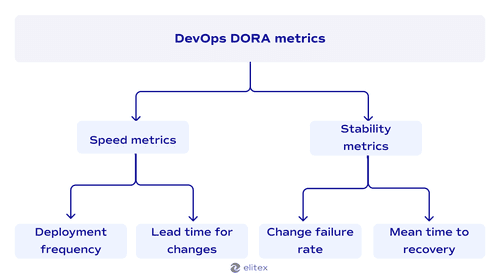
DORA stands for DevOps Research and Assessment. Google's DORA team developed this framework after years of studying thousands of engineering organizations to identify which key DevOps metrics actually predict software delivery performance. Four metrics emerged from that research, grouped into two pairs.
DORA speed metrics
Deployment frequency tracks how often your team pushes code to production. A team practicing continuous deployment might release dozens of times per day. Others deploy weekly or monthly. The number itself matters less than the trend. If your deployment frequency is declining, something in the pipeline is creating friction.
Lead time for changes captures the time between a developer's first commit and that code running in production. Long change lead times often point to manual approval gates, flaky test suites, or environment provisioning delays.
DORA stability metrics
Change failure rate tells you what percentage of deployments cause incidents, rollbacks, or require hotfixes. A low rate signals that your testing and review processes catch problems before production. A climbing rate means your quality gates have gaps, and pushing faster will only make things worse.
Mean time to recovery (also called time to restore service, MTTR) measures how quickly your team brings systems back to normal after a failure. Every production incident is a clock that starts ticking the moment users feel the impact. MTTR reflects how well your monitoring, alerting, and incident response processes work together under pressure.
Why these two pairs matter together
Optimizing for speed alone is easy. You skip tests, remove reviews, and ship. Your deployment frequency looks great until your change failure rate spikes. DORA forces teams to watch both sides of the equation at once. That balance is why it became the default starting point for engineering organizations serious about measuring delivery performance.
Benefits and limitations of DORA metrics
| Benefits of DORA metrics | Limitations of DORA metrics |
| DORA metrics DevOps framework gives teams a standardized way to benchmark delivery performance against industry peers, so your DevOps KPI targets are grounded in real data, not assumptions | DORA metrics focus on the CI/CD pipeline output but ignore what happens before code enters the pipeline. Planning delays and requirement churn stay invisible |
| Change failure rate and mean time to restore create a direct feedback loop between deployment quality and incident response, making software health measurable over time | The framework doesn't account for cycle time spent on code review, design discussions, or cross-team dependencies. Lead time for changes captures the total clock, but not where within that window the delays occur |
| DORA framework is lightweight. 4 metrics are easy to adopt without overhauling existing tooling or processes, which lowers the barrier for teams new to structured measurement | DORA says nothing about developer experience, team morale, or collaboration quality. A team can post strong DORA numbers while burning out |
| Speed and stability pairs reinforce continuous delivery discipline. Teams can't game one metric without the other pair, exposing the trade-off | All four metrics measure throughput and reliability of the delivery pipeline. Business impact, user satisfaction, and feature adoption sit outside DORA's scope entirely |
SPACE framework
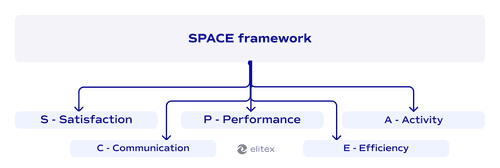
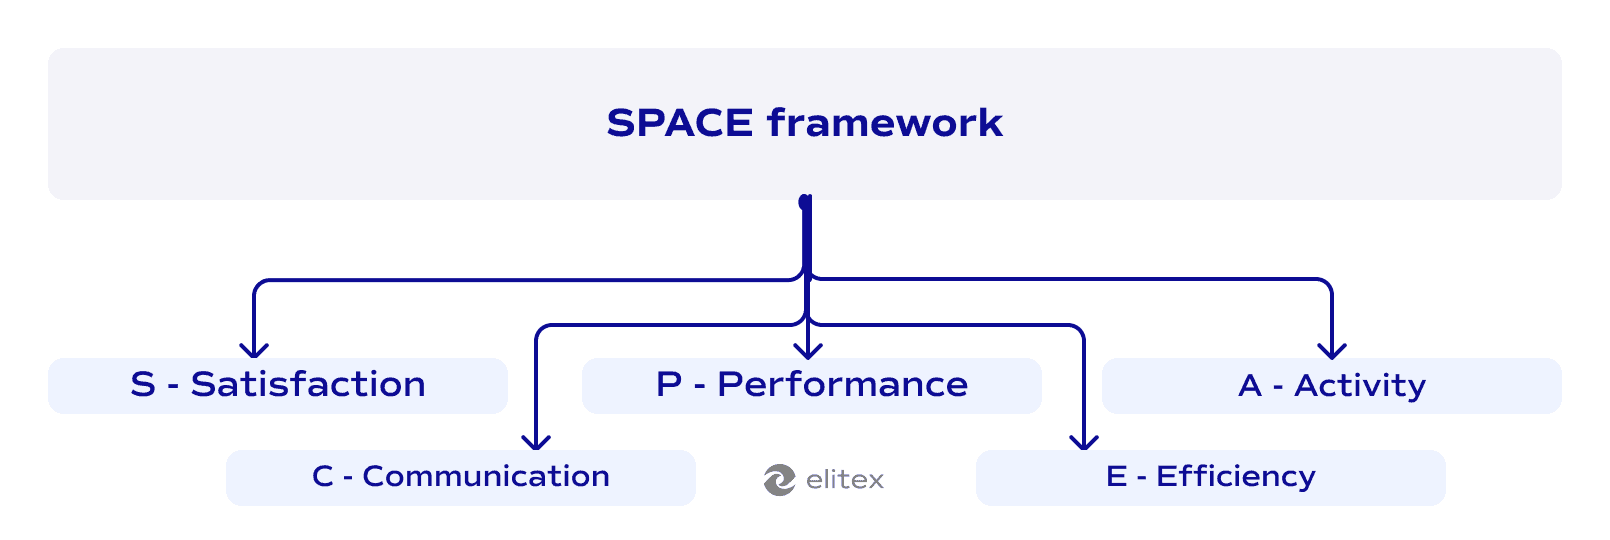
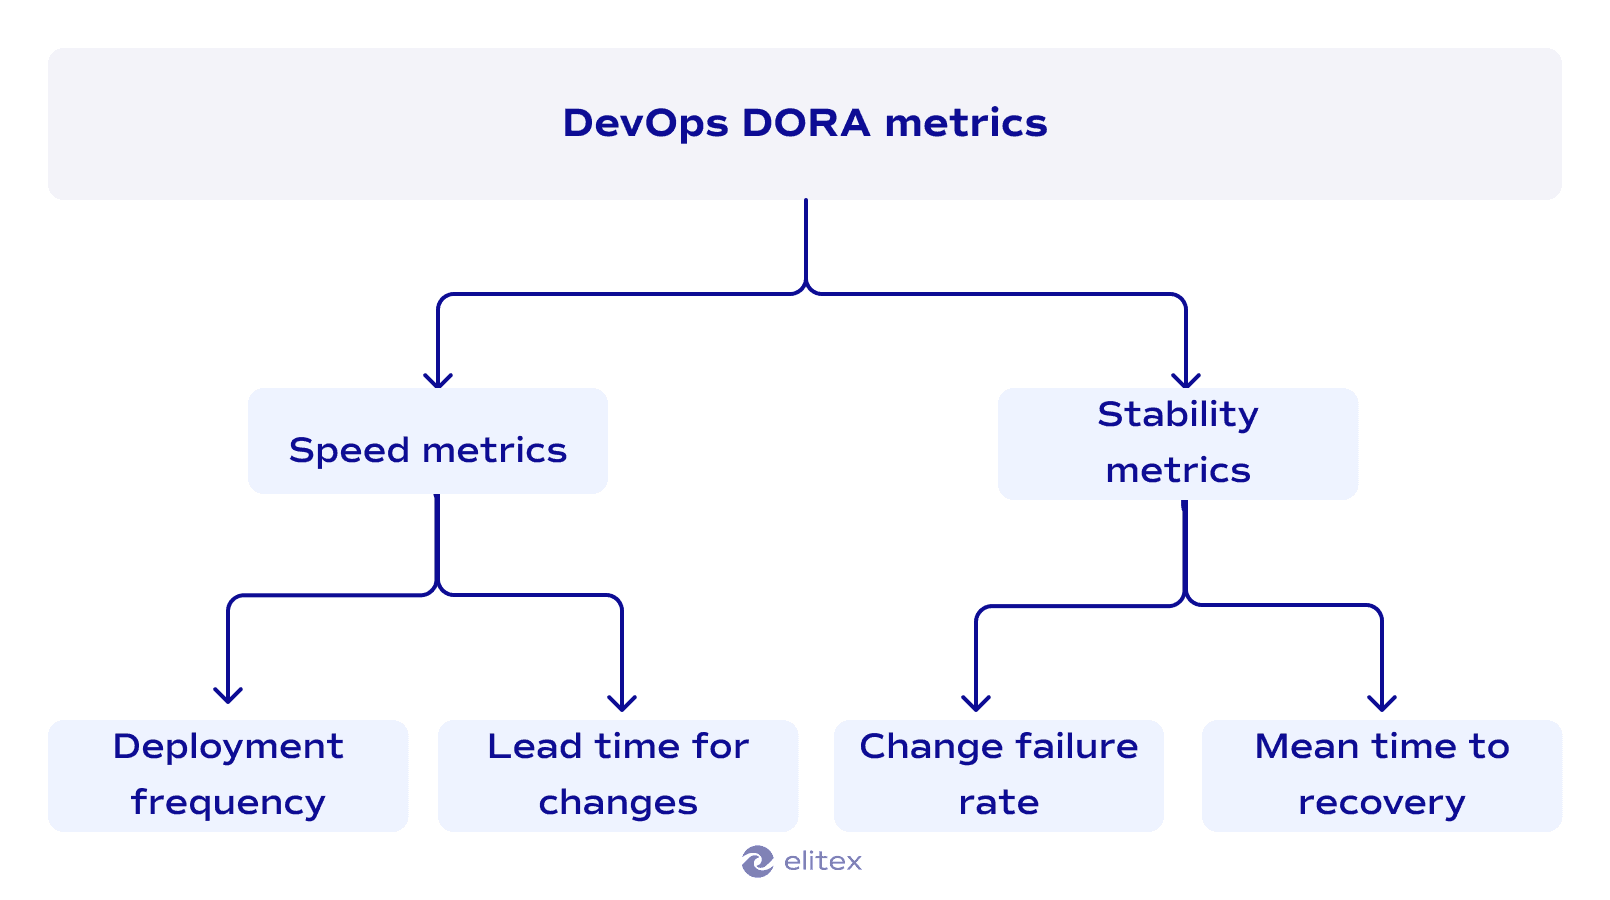
SPACE is another popular framework developed by researchers at GitHub, the University of Victoria, and Microsoft. Where DORA narrows in on delivery pipeline performance, SPACE broadens the lens. It treats DevOps metrics as a multi-dimensional picture that includes human factors alongside technical output. The acronym stands for five dimensions: Satisfaction and well-being, Performance, Activity, Communication and collaboration, and Efficiency and flow. The core idea is that no single dimension tells the full story, and teams should measure across at least three to avoid misleading conclusions.
Satisfaction and well-being
This dimension captures how engineers feel about their work. Burnout, frustration with tooling, and unclear priorities all drag performance down over time, but none of them show up in pipeline dashboards. SPACE treats satisfaction as a leading indicator. When it drops, other DevOps quality metrics tend to follow within weeks or months.
Performance
Performance in SPACE refers to the outcomes of work, not the volume. Did the code solve the intended problem? Did reliability improve? Did users benefit? This dimension pushes teams beyond counting deployments and toward evaluating whether those deployments actually moved the product forward.
Activity
Activity tracks observable actions: commits, pull requests, deployments, reviews. These are the easiest DevOps KPI metrics to collect, which makes them tempting to over-reliance on. SPACE acknowledges their value but warns against using activity as a proxy for productivity. High commit counts can mask rework, and low counts can reflect deep, focused problem-solving.
Also, read about DevOps observability
Communication and collaboration
Software delivery is a team sport. This dimension measures how effectively knowledge flows between people. Long review queues, siloed decision-making, and poor documentation all create invisible drag on cycle time. SPACE surfaces these collaboration patterns that purely technical frameworks miss.
Efficiency and flow
This is where SPACE overlaps most with DORA. It measures how smoothly work moves through the system with minimal interruptions or handoffs. Flow time tracks how long a unit of work takes from start to finish. Flow efficiency compares active work time to total elapsed time, including waiting. A task with a two-day flow time but only four hours of active work reveals a process heavy on queues and approvals.
How SPACE metrics compare to DORA
| Aspect | DORA metrics | SPACE metrics |
| Focus | Software delivery pipeline performance, especially continuous integration and deployment throughput | Multi-dimensional view of developer productivity and team health |
| Number of dimensions | Four metrics in two pairs (speed and stability) | Five dimensions, with recommendations to measure at least three |
| What it measures | Deployment frequency, lead time for changes, change failure rate, mean time to recovery | Satisfaction, performance outcomes, activity volume, collaboration quality, flow efficiency |
| Human factors | Not included. Team morale and burnout stay invisible | Built into the framework through satisfaction and collaboration dimensions |
| Ease of adoption | Lightweight. Four metrics, easy to instrument with existing CI/CD tooling | Heavier lift. Requires surveys, qualitative data collection, and cross-team coordination |
| Benchmarking | Strong. Google publishes annual State of DevOps reports with industry-wide benchmarks | Limited. No widely adopted benchmark dataset exists yet |
| Best suited for | Teams that need a clear starting point for measuring delivery speed and reliability | Organizations ready to look beyond pipeline output and evaluate how their teams actually work |
| Blind spots | Ignores developer experience, planning phases, and business impact | Can become complex to track consistently. Qualitative dimensions are harder to standardize |
How they work together: DORA and SPACE metrics complement each other. DORA provides the pipeline baseline that SPACE extends with human and process dimensions. Together, they form a more complete DevOps metrics framework than either achieves alone
Beyond DORA and SPACE: Operational metrics worth tracking
But DORA and SPACE aren’t the only two ways to track your DevOps performance. Here are additional useful metrics for software engineering teams.

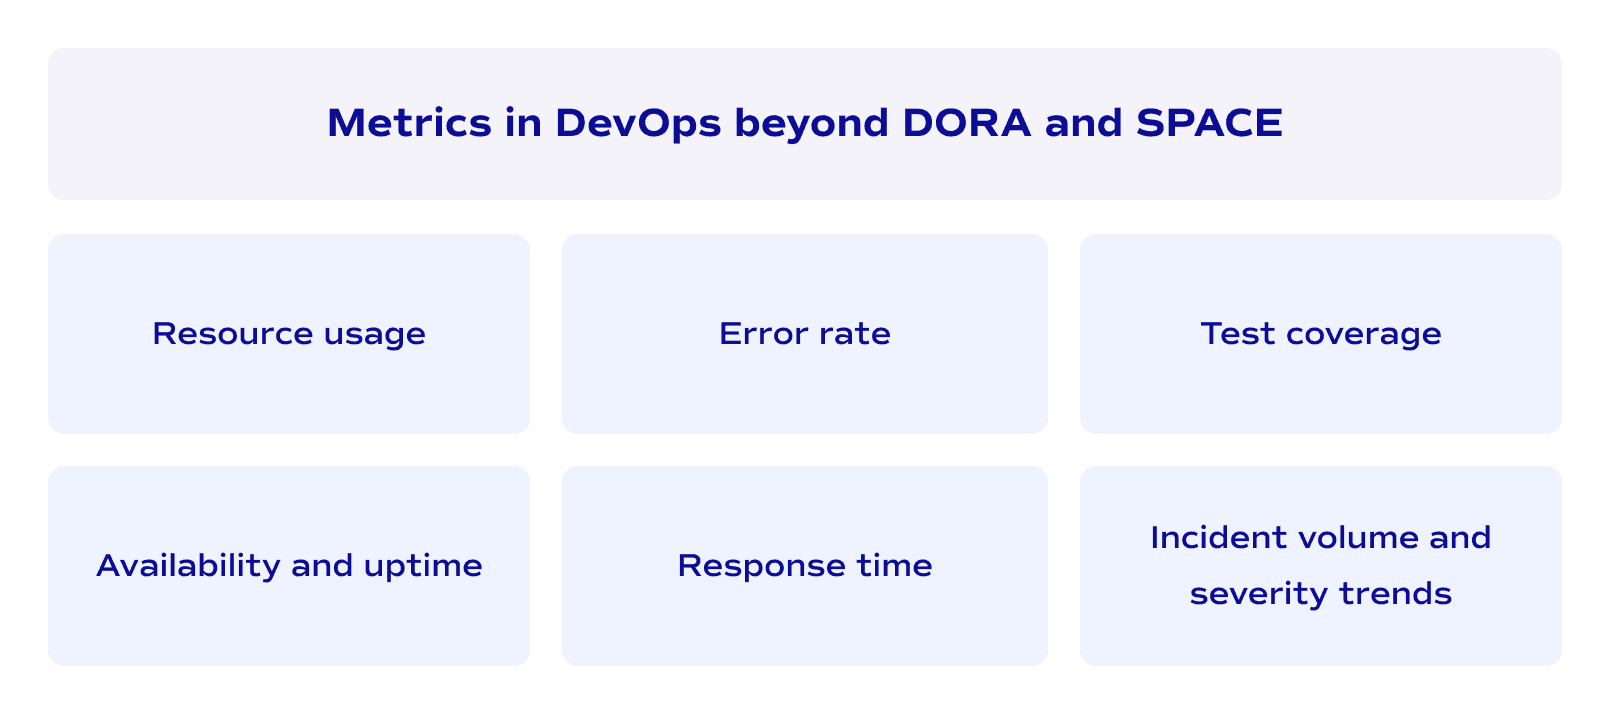
- Resource usage: keeping infrastructure costs under control tracks CPU, memory, and storage consumption relative to workload. When resource usage trends upward without a matching increase in traffic, your provisioning strategy needs attention.
- Availability and uptime: measuring reliability from the user's perspective is the DevOps performance metric your stakeholders care about most. The gap between your uptime target and your actual number drives every infrastructure investment decision.
- Error rate: catching degradation your pipeline misses measures the percentage of failed requests across your services. As a DevOps quality metric, it catches problems that deployment-focused frameworks overlook entirely. A release can pass every pipeline check and still push your error rate up if edge cases slip through testing.
- Response times: connecting engineering work to revenue shows how fast your application answers user requests. This is one of those DevOps business metrics that ties engineering effort directly to business outcomes. Even a 200ms slowdown on a checkout page can measurably reduce completed purchases.
- Test coverage: knowing how much of your code you can trust quantifies what percentage of your codebase automated tests actually exercise. Low coverage means your pipeline gives you false confidence. High coverage doesn't guarantee quality on its own, but it dramatically reduces the blast radius when something breaks.
- Incident volume and severity trends: seeing whether things are getting better reveal whether your DevOps quality metrics are improving or just fluctuating around the same baseline. Raw incident counts matter less than the direction over time.
How to choose the right metrics for your project and goals
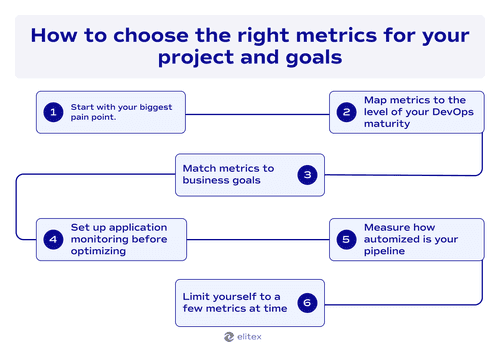
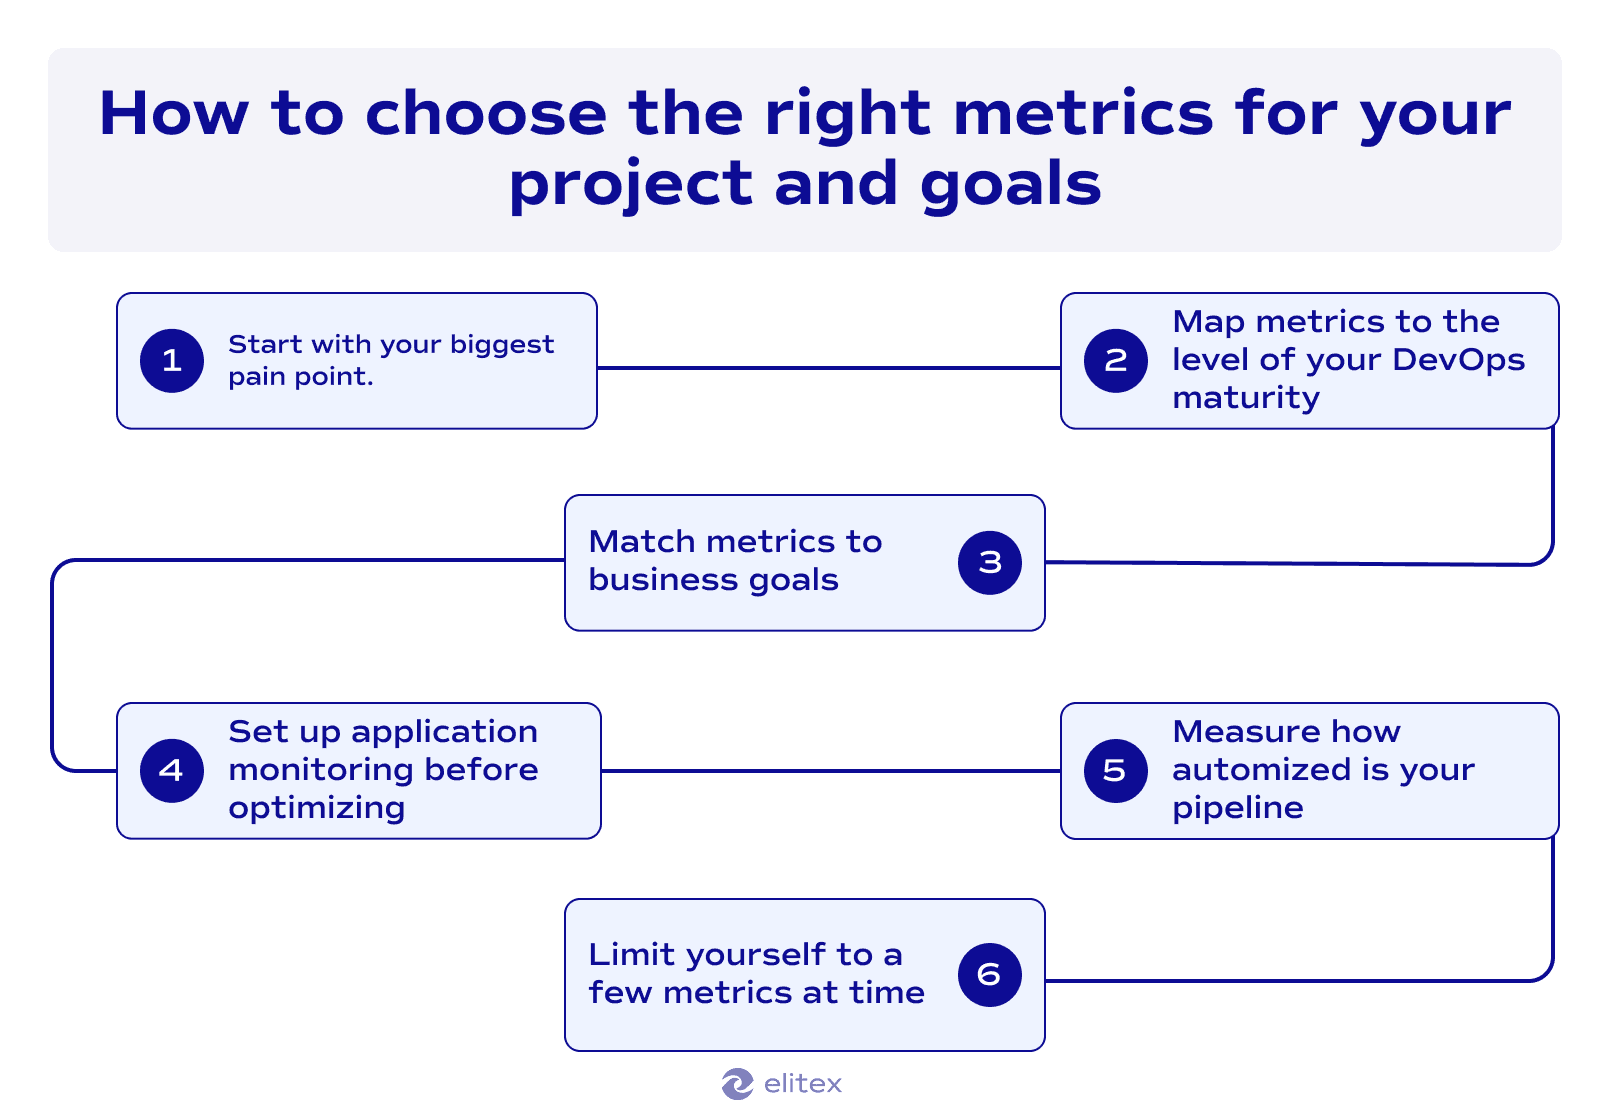
- Start with your biggest pain point. If deployments break constantly, focus on change failure rate and how fast your team responds to incidents. If releases take weeks, measure lead time. Let the actual pains guide the measurement.
- Map metrics to your DevOps maturity rate. Early-stage teams benefit from basic deployment frequency and error rate tracking. Mature teams with stable pipelines can layer in flow efficiency and satisfaction scores. So, think about what is relevant for your maturity level.
- Match metrics to business goals. Revenue-sensitive products need objective measurements like response time and uptime. Compliance-heavy environments need audit trail coverage and change failure rate. Pick what your stakeholders actually ask about in meetings.
- Set up application monitoring before you try to optimize. You can't improve what you can't observe.
- Measure how much of your DevOps pipeline runs without human intervention. A low automation percentage almost always correlates with long lead times and high error rates. That single number tells you where your next engineering investment should go.
- Limit yourself to five or fewer metrics at a time. These are the DevOps metrics that matter for your team right now. More than that, and people stop paying attention to any of them.
Best practices to improve DevOps metrics
- Tie every metric to a specific owner. When nobody owns a number, nobody improves it.
- Automate everything you measure. Manual data collection leads to inconsistent tracking. If a metric requires someone to update a spreadsheet, it will decay within weeks.
- Set baselines before setting targets. Spend the first month collecting metrics without trying to change anything. You need to know where you stand before deciding where to go.
- Review DevOps metrics and KPIs in a fixed weekly cadence. Metrics that only surface during quarterly reviews lose their power to drive daily decisions. Short feedback loops keep teams responsive.
- Treat incident management as a learning system, not a blame system. Blameless postmortems turn production failures into process improvements. Blame-driven cultures produce teams that hide problems and game their numbers.
- Invest in observability before optimization. Dashboards that show real-time pipeline health help teams act on metrics in DevOps as they change, not days later when a report lands in someone's inbox.
- Rotate your focus quarterly. Trying to improve all DevOps metrics and KPIs simultaneously spreads effort thin. Pick two or three metrics per quarter. Go deep on those. Move to the next set when the numbers stabilize.
- Benchmark against yourself, not against Google. Industry averages provide context, but your improvement trajectory matters more than matching an elite-performer threshold that doesn't reflect your team size or product complexity.
- Remove vanity metrics from your dashboards. Numbers that always look good and never prompt action take attention away from metrics that reveal actual problems. If a metric hasn't triggered a conversation in six months, question whether it belongs.
- Share metrics with the entire team, not just leadership. Engineers who see the impact of their work on deployment frequency and failure rates make better daily decisions. Metrics locked in management dashboards lose half their value.
Specific DevOps metrics tools
Tracking all these numbers manually doesn't scale. Specialized DevOps metrics tools automate data collection from your pipelines, infrastructure, and repositories, then visualize everything in a single DevOps KPI dashboard. (If you're still building out your automation stack, our guide on DevOps automation tools covers the foundational layer these metrics tools sit on top of.) Here are the most widely adopted metric tracking options.
Datadog
Datadog offers end-to-end visibility across infrastructure, applications, and CI/CD pipelines in a single platform. Its strength is correlation. You can trace a deployment event through pipeline logs, application performance data, and infrastructure metrics on one screen. The trade-off is cost. Datadog's per-host pricing scales fast, and teams often discover their bill growing quicker than expected once they instrument everything.
Grafana
Grafana connects to data sources you already have (Prometheus, InfluxDB, and Elasticsearch) and lets you build a custom DevOps KPI dashboard without locking into a single vendor. That flexibility attracts engineering teams who want full control over their monitoring stack. The downside is setup time. Grafana requires more configuration work upfront compared to fully managed alternatives.
LinearB
LinearB focuses specifically on engineering efficiency metrics. While Datadog and Grafana cover broad infrastructure and application monitoring, LinearB pulls data from Git, project management tools, and CI/CD systems to surface cycle time, review bottlenecks, and DORA metrics automatically. It fills a gap that general-purpose DevOps metrics tools leave open: connecting pipeline data to team workflow patterns.
How ELITEX can help with improving your DevOps metrics
At ELITEX, we have spent over a decade helping companies figure out how DevOps delivery value is measured in practice. Our DevOps consulting services always start with auditing your current pipeline and identifying which key DevOps metrics deserve attention based on your product stage and business goals. Because our engineers are 90% mid-level and senior, they've seen enough systems across healthcare, fintech, ecommerce, and publishing to recognize patterns fast. That maturity means fewer false starts. We don't experiment on your infrastructure. We apply what already works and communicate openly about what doesn't.
On the implementation side, our DevOps infrastructure automation services and automation strategy consulting services focus on turning metric insights into measurable pipeline improvements. We build monitoring, automate bottlenecks, and restructure CI/CD workflows so your numbers actually move. Our distributed team model also keeps costs significantly lower than Western European or US-based alternatives without compromising engineering depth. So you get experienced engineers who improve your delivery performance at a price point that makes long-term investment sustainable. When choosing ELITEX’s engineers, you choose the result beyond any initial expectations.


FAQs
What are DevOps metrics?
DevOps metrics are quantifiable indicators that show how well your development and operations processes work together. They measure everything from deployment speed and failure rates to infrastructure costs and team collaboration patterns.
What are DORA metrics and SPACE metrics?
DORA metrics are four indicators developed by Google's research team: deployment frequency, lead time for changes, change failure rate, and mean time to recovery. SPACE is a broader framework from GitHub, Microsoft, and the University of Victoria that adds satisfaction, performance outcomes, activity, collaboration, and efficiency to the picture. DORA measures pipeline output. SPACE extends that view to include how teams actually work and feel.
How do I build a DevOps metrics dashboard?
Start by connecting your CI/CD system, version control, and monitoring tools to a visualization platform like Grafana, Datadog, or LinearB. A good DevOps metrics dashboard surfaces your most important indicators in real time and avoids clutter. Focus on five or fewer metrics. Add more only when your team has built a habit of reviewing the existing ones.
Can DORA and the SPACE frameworks be used together?
Yes. Many mature organizations layer SPACE on top of DORA. DORA gives you a delivery speed and stability baseline. SPACE adds developer satisfaction, collaboration quality, and outcome measurement. Together, these DevOps metrics frameworks cover both the technical and human sides of performance.
Which DevOps metrics matter most for business stakeholders?
Response time, uptime, error rate, and change failure rate translate most directly into revenue impact and operational risk. These DevOps metrics key performance indicators speak the language business leaders already use. Stakeholders rarely ask about commit counts or build durations.
How do I choose the right DevOps metrics key performance indicators for my team?
Start with your biggest bottleneck. If releases break often, track the change failure rate and recovery time. If they take too long, measure lead time and deployment frequency. Align every indicator with a specific business goal so the numbers drive decisions, not just decorate dashboards.
POSTED IN:
