


In this article, we will look at some recommended procedures for logging microservices and the architecture needed to manage distributed logging in the microservices environment. The goal is to share a guide for configuring structural logging with a Google Cloud Provider using Node.js and Nx tools. We will also go over best practices for microservices logging.
Any application, whether monolithic or microservices-based, must have an application log; however, logging into microservices-based systems is challenging due to their core architecture. Given this, software engineers must follow best practices for microservices logging to guarantee app performance.
What is logging in microservices?
Traditionally considered one of the Node.js development services and DevOps automation services, logging into microservices has additional benefits that can be provided with the structure. It also has specific challenges because a single request in this architecture may stretch over numerous services and even travel back and forth. That is why we need a microservices logging and monitoring system to track the end-to-end stream of a request via the system and locate the cause of bugs.
Writing information to a single log file and later reading it is everything you need in order to log into a monolith. A microservices-based application consists of numerous interacting components. Services may be distributed across many servers and even over different countries. Since each microservice retains its own data set, this generates multiple log files.


What is microservices architecture?
We have a separate article dedicated to the role of microservices architecture in DevOps.
Microservice architecture is an approach in software development structuring applications as a collection of small, independent services. Here, we have an example of article of using microservices for eCommerce applications. Microservices architecture often implies building nx monorepo consisting of separate microservices. When it comes to this pattern, each particular service is designed to perform a specific function and communicate with other services through a predefined interface.
The main benefit of this service-oriented architecture structural style is that it makes it easier to develop and maintain each service as well as adopt new individual technologies and tools for specific services without affecting the rest of the application. When it comes to logging in microservices architecture, each service generates its own logs. It’s essential to pay particular attention to microservice logging, as it significantly improves general troubleshooting. In this way, effective tools and practices are crucial for ensuring the reliability and performance of microservices logging architecture.
Why do we need logging in microservices?
Software development inevitably faces bugs and unexpected failures. Programming often entails writing and testing code continuously to fix all flaws. Programmers use logging as a critical tool to comprehend the state of a system and evaluate whether functions were carried out as intended. Developers can quickly identify potential problem areas in code by using solid logging instead of spending a lot of time searching through the entire codebase.
Here, we have one of the good examples to understand what Node.js is used for. Logging is even more crucial in the world of microservices, where modular components individually perform a limited set of tasks to control the complexity brought on by a fragmented architecture. Microservices have advantages over monolithic applications in terms of flexibility and scalability. But if any issue occurs, engineers will need to identify it across a wide range of services.


A microservices-based program may operate several services that interact with one another. When one or more services stop working, things become complicated. Decoding the entire request path in microservices is challenging. Developers need to understand the whole request flow, including which services were used, how frequently they were leveraged, and in what order.
You should have accurate records available and a separate ID to correlate requests to respond to these concerns. Also, you should have a suitable method for tracking errors that may include multiple microservices. Moreover, as the business logic of your applications is distributed across various microservices, the complexity of monitoring and logging increases rapidly.
Nowadays, the microservices logging tool has become essential not only for tracking errors but also for collecting important metrics from an application. This valuable data can help understand the internals of microservices and make them more efficient and error-resilient.
Microservices project context
In the analyzed case, our application consists of two back-end microservices. So, using our logger library, we can track what happens in a specific environment with a particular microservice. For this, let us use a monorepo approach, creating two back-end services and a common logging solution. We will use a library built on a Winston logger lib.
Also, let’s agree to use two common “logging tags”: environment and service. They will help us filter logs and build logging microservices metrics by environment and service.
Microservices logging Implementation
Let’s create a monorepo with two express API services and a common logger library.
Monorepo initialization
# Create actually monorepo “logging”
$ npx create-nx-workspace@latest logging

# Create first service - service1
$ nx generate @nrwl/express:app service1

# Create second service - service2
$ nx generate @nrwl/express:app service2

# Create a common logger lib, which can be imported by a path “@libs/logger”
$ nx g @nrwl/js:lib logger --buildable --publishable --importPath="@libs/logger"
Logger library implementation
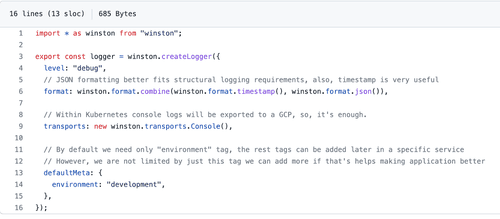
Let’s build our logger library using the powerful Node.js Winston library.
Open generated by an Nx tool libs/logger/src/lib/logger.ts file and add the following lines:
How to use a logger in a codebase
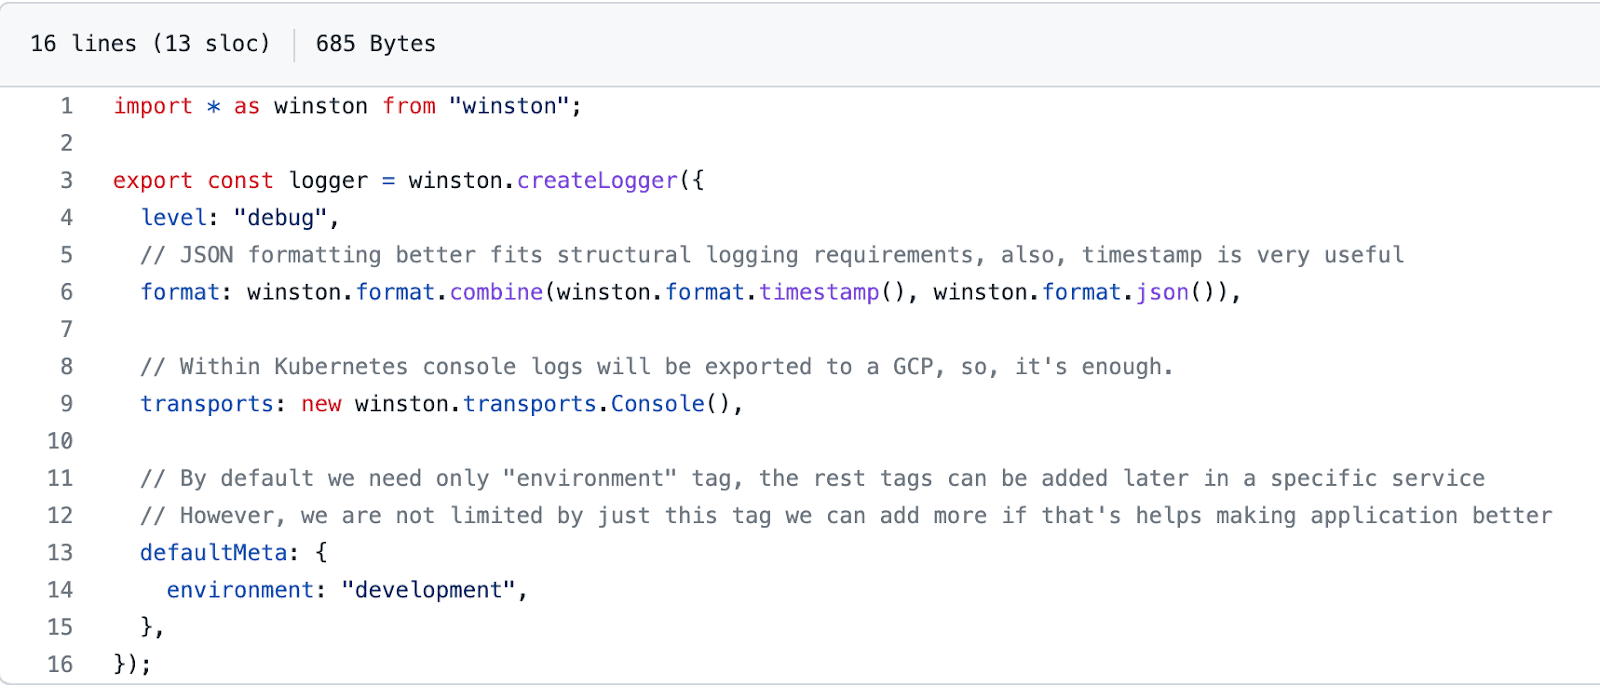
Let’s use our logger “creature” in a microservice. This is as easy as importing the lib.
Open any of the generated by the Nx service’s files – apps/service1/src/main.ts or apps/service2/src/main.ts and add the following lines:

How to use structured logs at GCP
GCP Logging supports a powerful search language that fully covers our needs. It also can build custom metrics based on specific logs: counter – to calculate the number of entries and distribution – to see numeric values over time. Programmers can use all these custom-defined metrics to build dashboards and alerts. That significantly improves the visibility of the system internals. So, accounting for all the above, we consider logs not just as simple text records but also as potential custom metrics that we can leverage for system alerting and monitoring.
How to filter logs by logger tags in a GCP logging platform
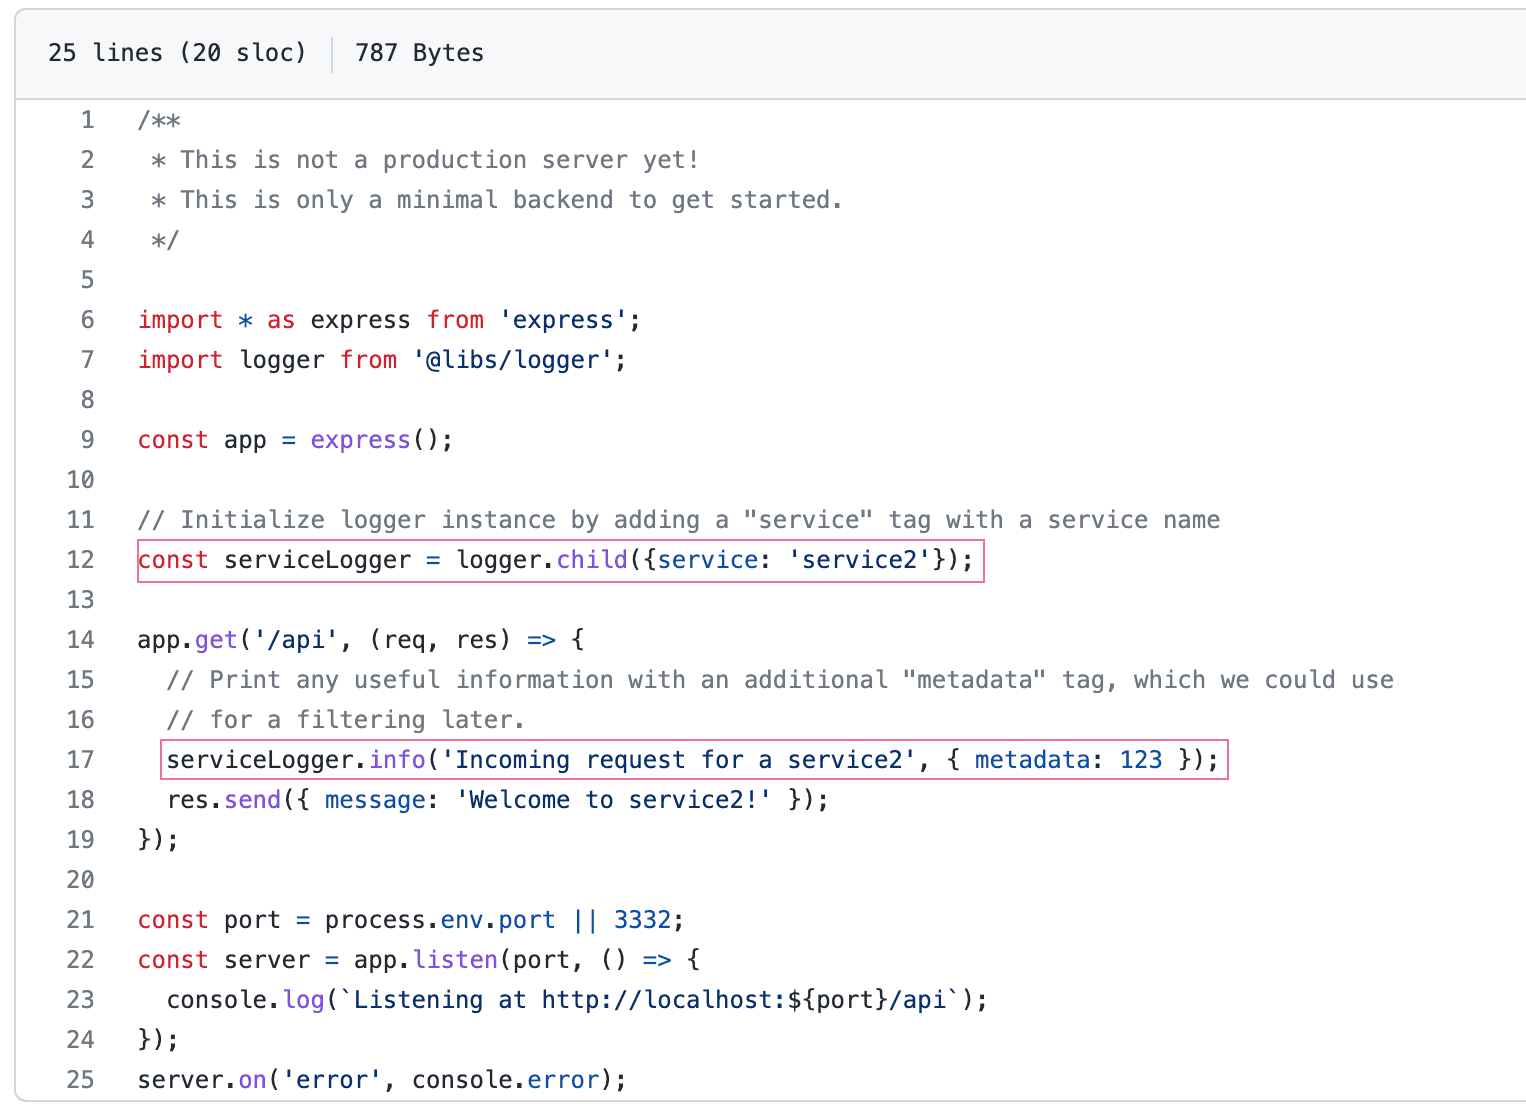
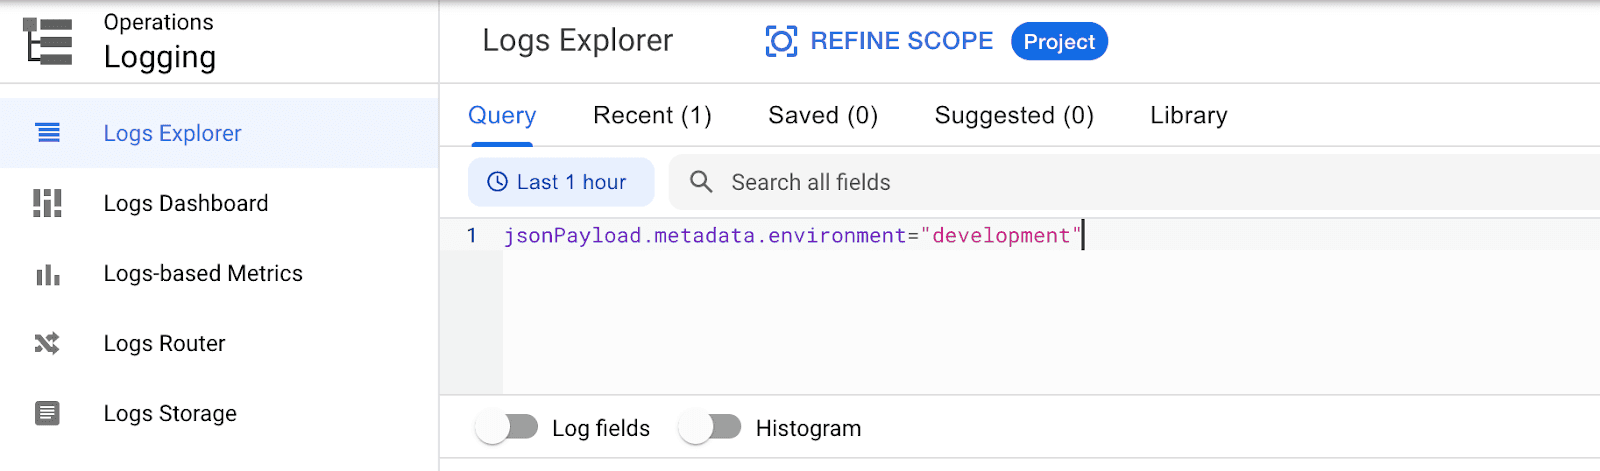
We consider a scenario where our microservices are hosted by Kubernetes or Cloud Run. So, all log messages will be reported to a GCP Logging, and we can filter them by defined tags: environment and service.
- To extract logs from a specific environment for all services, enter the following query
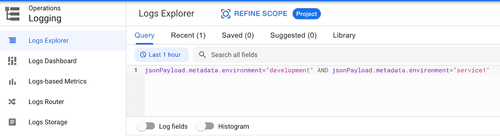
- To extract logs from a specific environment for a specific service, enter the following query

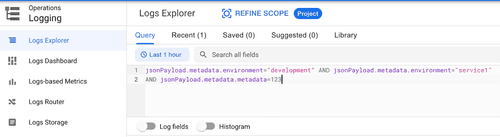
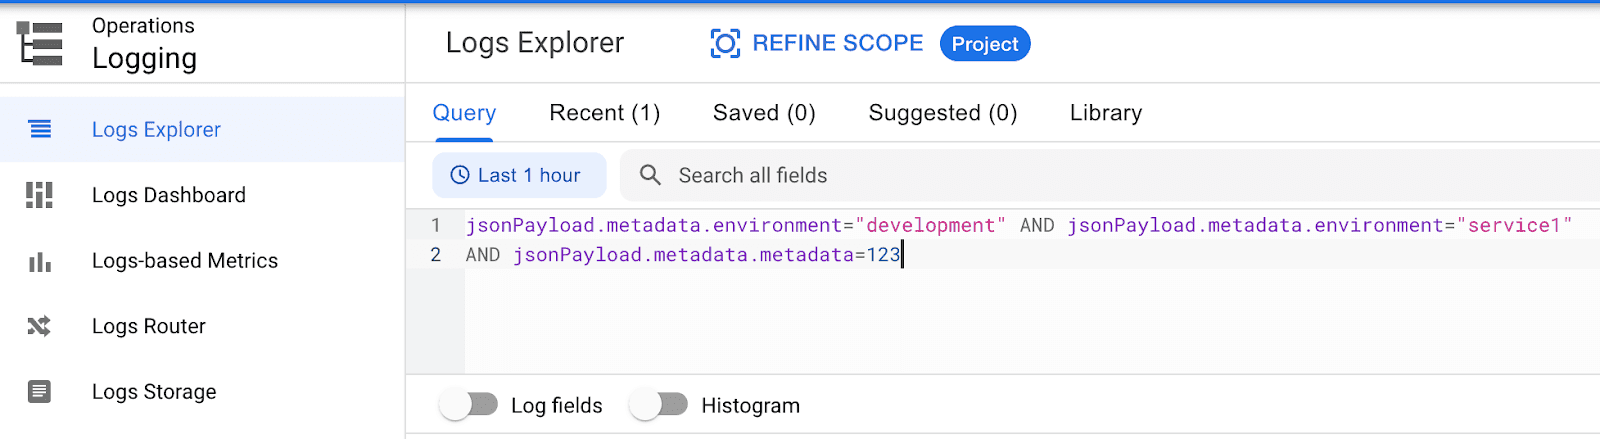
- To extract logs from a specific environment for a specific service by a custom field (“metadata” from an example above), enter the following query
You may also be interested in our article: Better and Secure Deployment Process to AWS with Bitbucket
Microservices logging best practices and tips
Both monoliths and microservices share fundamental components of any efficient logging strategy. We will cover a few essential factors. If you log everything, you run the risk of filling up your disk with huge files. It can take a while to access a large logging component or file and run a search through it. However, excessive shortness may render logs meaningless when it comes time to troubleshoot a specific problem. In any case, record details like special identifiers showing what the program was executing when it made an error. Consider which information is worth logging for metrics analysis, auditing, or other business purposes besides the debugging use case.
Generate unique IDs to correlate requests
Microservice interaction occurs through an HTTP endpoint. End customers are only familiar with API requests; they have no idea how services operate. Developers can separate groups of processes and keep track of specific requests by using correlation IDs, which are distinctive identifiers. The correlation ID needs to be unique, available to downstream services, and thoroughly recorded alongside other crucial service call information. With access to these logs, troubleshooters can do an ID search to discover information about specific service calls, including how frequently they were made. The correlation ID can then determine the transaction logging failures and services in which they occurred.
Standardize log format
You can employ various technology stacks for each service by utilizing microservices architecture. Let’s assume that Python is used for the inventory service, Java for the shipping module, and .Net for the payments management. It will impact the logging for these services, having different formats and fields. Standardization is crucial for integrating microservices logs amongst other services. You will need to select a unique format and use it consistently throughout all of the logs, using the same naming rules. Keys and value names should match when microservices are handling the same data.
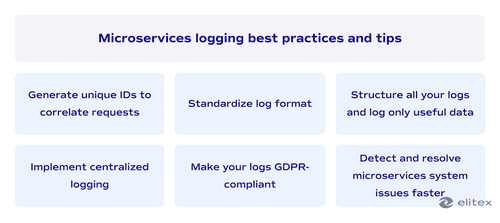

Log only useful data
You can log all the data that you get. However, we recommend focusing only on the information that might be helpful in troubleshooting to optimize the process and storage usage. Log when events happened with the same timezone for all logs. Register the type of errors. Record where and the particular service in which it occurred. You must know the function name or file name where the error happened.
Structure all your logs
The standardization of logs may be affected if a microservices-based app employs multiple structures to log data in distinct stacks. For instance, one service might use a pipe symbol and another a comma in order to separate fields. Therefore, tech experts will not be able to conduct the same level of analysis on each log. By using a consistent entry format, you can standardize logging. A single format enables developers to query, search, and analyze the log data quickly. Logs are made easier thanks to structured logging for microservices.
Implement centralized logging
With centralized logging, microservices apps can take full advantage of their benefits, such as scalability and higher developer velocity. At the same time, they will keep a single source of the log data. Developers and analysts who rely on log analysis to improve the system will benefit from this. Log aggregation significantly reduces troubleshooting complexity since several files are not required to perform an analysis.
Make your logs GDPR-compliant
In microservices, you might log requests from end users that include personally identifiable information. Watch out, as it might contradict the GDPR requirements. Logging tools for microservices collecting PII, like passwords and social security numbers, must be avoided, especially if local regulations forbid this practice. Privacy concerns are raised because engineers may need to go through logs for debugging purposes, making all the personal information potentially visible to other people. If you need to study user behavior, create a system where logging will combine particular sensitive data types and, at the same time, maintain anonymity.
Detect and resolve microservices system issues faster
In a microservices-based application, logging is crucial, but you should be aware of the problems and fixes as well as have intimate knowledge about the microservice logging best practices. Microservices must be monitored since the growing complexity of software might make it challenging to monitor its performance and identify issues. DevOps automation can help collect metrics from the microservices and then use those measurements to obtain insights into how the system operates with the help of an effective logging system.
Data tracing allows programming teams to assess system performance to measure the impact of changes, and it also enables rapid issue detection and resolution. We hope that our approach to structural logging configuration with a Google Cloud Provider, Node.js, and Nx tools will make it simpler and more efficient for your programming teams to keep track of your microservices system downturns. If your company needs support on microservices infrastructure monitoring and management, do not hesitate to get in touch with our IT experts.
Final thoughts about microservices logging
In conclusion, logging is a critical aspect of any modern software system that relies on microservices architecture. Proper logging enables skilled developers and DevOps specialists to monitor and troubleshoot complex distributed systems more quickly and effectively. With microservices, logging becomes more complex as each service generates its own logs, and aggregating these logs requires careful consideration of the logging tools, storage, and analysis utilities used.
It’s vital to adopt a standardized approach to logging, including defining log formats, logging levels, and log correlation strategies to avoid some common logging challenges. Additionally, leveraging modern log management tools supporting centralized log collection, aggregation, and analysis can simplify the whole development process and troubleshooting. Proper microservices logging can help organizations reduce downtime, improve system performance, and, therefore, enhance operational efficiency.


FAQ
Why is logging important in microservices?
The importance of logging in microservices consists of several factors. It allows you to monitor and troubleshoot complex distributed systems more efficiently, reducing downtime and improving overall performance and operational effectiveness.
What challenges may I face in logging microservices?
Some common logging microservices challenges include dealing with large volumes of log data generated by multiple microservices and inconsistencies in log formats across different microservices. Also, tracing and correlating logs from other microservices for identifying and debugging issues and ensuring the security of data, as well as reliable storage and retrieval of log data, may be quite challenging.
What are some common log data formats and protocols used in microservices logging?
The list of most popular data formats among developers includes JSON, Syslog, and Apache-like log formats. When it comes to protocols, those would be Syslog, Fluentd, and Log4j.
How can I use distributed tracing to correlate logs across different microservices?
Distributed tracing involves tracking and correlating logs across various microservices to identify performance bottlenecks, errors, and other issues. By adding unique identifiers (IDs), distributed tracing utilities may help map out the glow of requests and provide valuable insights into the root cause of issues.
How can log aggregation and analysis tools help with monitoring and troubleshooting microservices?
Log aggregation and analysis utilities can help centralize log data and provide insights into performance and errors. You can identify patterns and anomalies in log data, as well as enable advanced analytics and alerting to help detect and respond to issues in real time.
How can log data be secured and reliably stored and retrieved?
Log data can be secured using secure transmission protocols, such as TLS/SSL. Log data should also be stored in secure and scalable storage systems to ensure retrieval of log data. Also, access controls and audit trails should be implemented to help maintain data integrity and ensure compliance with security and privacy regulations (e.g., GDPR).
POSTED IN:
